Colorado Springs Housing Market Summary
Colorado Springs Metrics
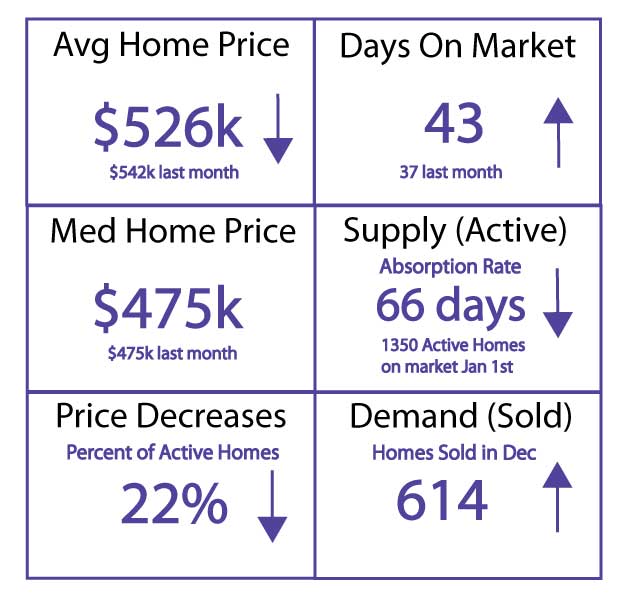
| Median Home Price = $475,000 ⇓ $475,000 median price last month $445,000 median price last year |
| Average Home Price = $526,000 ⇓ $542,000 average price last month $498,000 average price last year |
| Avg. Days on Market = 43 days ⇑ Average 37 DOM last month Average 41 DOM last year |
| Inventory (supply) = 66 days ⇓ 90 days Inventory last month 60 days Inventory last year |
| Home Sales (demand) = 614 ⇑ ⇑ 6% increase from last month ⇓ 13% decrease from last year |
| Price Decreases on Actives = 22% ⇓ 42% last month |
| Distressed Properties = 11 Sold Dec ⇓ Public Auction = 6 Sold in Dec MLS Listings = 5 Sold in Dec Total Sold in Nov = 21 |
Today’s Interest Rate Trend
| Conv Interest Rates = 6.76% ⇓ VA/FHA Interest Rates = 6.12% ⇓ |
The Federal Funds rate did not increase this last month but the 10 year treasury yield more importantly dropped from about 4.22% to about 4.04% which is the main driver to mortgage interest rates which dropped about .2% over the last month. The yield curve remains very inverted and signals a recession.
Current Avg. Rates as of Today
Most Desirable Places to Live
Colorado Springs ranks #2
As of July 19, 2023
by US News & World Report
- 25. Raleigh and Durham, North Carolina
- 24. San Antonio, Texas
- 23. Charleston, South Carolina
- 22. Eugene, Oregon
- 21. Virginia Beach, Virginia
- 20. Savannah, Georgia
- 19. Seattle
- 18. Santa Barbara, California
- 17. Melbourne, Florida
- 16. Jacksonville, Florida
- 15. Orlando, Florida
- 14. Tampa, Florida
- 13. Fort Myers, Florida
- 12. San Francisco
- 11. Daytona Beach, Florida
- 10. Port St. Lucie, Florida
- 9. Charlotte, North Carolina
- 8. Portland, Oregon
- 7. Sarasota, Florida
- 6. San Diego
- 5. Naples, Florida
- 4. Los Angeles
- 3. Honolulu
- 2. Colorado Springs, Colorado
- 1. Myrtle Beach, South Carolina
Thinking of Buying or Selling?
Get a free consultation
Home Selling Program
Discover why we are Top Rated
Get a Monthly Market Update
know when the market changes
Colorado Springs Housing Market Summary
The question I get asked the most is; How’s the market, do you think the market is going to crash? Let’s look at our headlines here and analyze what each of these mean and try to determine what the market is doing. In March 2022 my short answer was that I don’t think the market is going to crash any time soon, not this year anyway. Now here in November 2023 we can see the market is declining for sellers and it is harder to sell a home. But the housing market certainly is not crashing.
What’s the Outlook for the Colorado Springs Housing Market?
In one sentence, I’d say the outlook is that home prices will be coming down more over the next year. I did say in Feb 2023 that I think it is quite possible that housing market prices will correct downward significantly in 2023, then stabilize in 2024. I was wrong about that, housing prices here in Colorado Springs have remained steady. A housing crash is when home prices decline suddenly by a significant amount in a short period of time. A housing crash isn’t clearly defined but you know when it happens. So in general, I would say a sudden decline or crash in prices by 20% over a span of 3 months would be a good guideline to say crash. I think prices will come down 20% in 2024 but it will be over the entire year, so I would say a significant price correction.
The average home price in June 2023 was $563,470, the highest it has ever been in Colorado Springs. If the average home price in June 2024 drops to $450,400 or below, then I’d say we had a crash or significant housing correction. Currently as of January 2024 the average home price is $526,000, not much change.
1. $16,000 Decrease in Average home price since last month.
Last month in December 2023 the average home price went down 16,000 from November. The average home price has been oscillating up and down about $10,000 over the last several months. Similarly, the Median Home Price has been oscillating up and down, it’s high was $494,000 in June and now is $475,000. We hit the top for Median home price at $500,000 in June 2022 and almost reached that point with $494,000 in June of 2023. It is truly amazing that home prices have remained resilient in Colorado Springs. Given the steady increase in supply and the slowing Absorption of homes, prices are likely to come down.
2. Days on Market Increases to 43 Days
This is an odd metric to see days on market go down a little since supply is up and demand is down. Also, the Absorption rate has declined to 66 days which is the best indicator of a slowing sellers’ market. In February the average days on market was at a high for the year at 54 days on market. I expect the days on market to go to 60 in February 2024 based on the Absorption rate calculation which you can see below. Affordability with high interest rates is crushing demand and so days on market is going up. Supply is steadily increasing too and so more homes sitting on the market is increasing days on market. Throughout history 60 days on market is not that high and it is fairly normal, but sellers have been spoiled over the last few years. We can see the amount of homes with 30+ days on market is at 54% and homes with 60+ days on market is at 76% and these numbers are climbing.
3. 6% Increase in Demand since last month, Absorption Rate hits 90 days
Demand has decreased and so supply is increasing. This month there are 400 less Active homes on the market than last month hovering around 1350. About 1500 to 1750 Active homes on the market in Colorado Springs is a healthy number. The increasing demand and general decrease in supply of inventory has caused the Absorption rate to come back down to 66 days from 90 days last month. Absorption rate is the days of available homes on the market. This means that if no more homes were listed today, it would take that long for all the homes to sell. Last month the December home sales dropped 13% from the previous year. A 13% decrease in home sales is significant at only 614 homes sold last month. Although Buyer demand is down across the country, Colorado Springs ranks #2 as most desirable places to live.
Absorption Rate vs Days on Market
The Absorption rate number has increased over the last several months, which means a slower market. In November, the Absorption rate number increased primarily because less demand. The supply and demand curve will push home prices lower. We’ll look at supply and demand causes more in the paragraphs to come.
When Absorption rate goes up, typically days on market goes up too. Days on Market is going up steadily because demand is slow. Savvy buyers are looking for deals, they know there are a certain percentage of sellers that are motivated to sell that will drop the price $10s of thousands to just move on with their lives. So, prices will come down and sellers need to get ahead of the downward curve if they want to compete and get their home under contract.
Calculating Absorption Rate
By using what is called an Absorption Rate calculation we can best determine if we are in a Buyer’s or Seller’s market. Absorption Rate is a measurement of the rate at which a group of homes in a particular area get processed through the system. So, Absorption Rate does not measure inventory as to number of homes actively on the market. Absorption Rate measures inventory as to the number of days left of available homes. The current Housing Absorption Rate of 66 days means that if no more homes were listed on the market as of today, it would take just 66 days (30 days per month x 2.2 absorption rate) for all the homes currently listed to be sold. We use our Absorption Rate calculation in our Market Index formula to determine a score that expresses the type of market we are in.
4. 22% of Homes on the Market have had a Price Reduction.
What this means is that for Active homes on the market in December, 22% of the homes had a price decrease. Typically, in a normal market, about 33% of homes on the market have a price decrease. Because rates have come down a little over the last month, demand has picked up a little. Supply has increased steadily over the last many months, but it has come back down a little going into the winter months.
5. Colorado Springs Ranks # 2 Most Desirable Place to Live, # 9 Best Place to Live!
As of July 2023, it has been reported by US News & World Report that Colorado Springs ranks as their #9 Best Place to Live. There typically has been a shortage of available homes for sale in Colorado Springs because demand has been high. As a result of higher interest rates and higher home prices, there is less demand and so less multiple offer situations. Home prices have remained steady and so affordability is affecting Colorado Springs best places to live ranking fairly significantly. However this doesn’t change its desirability rating so much as it is ranked #2 this year, dropping from #1 last year.
Colorado Springs is ranked consistently as one of the best places to live according to U.S. News & World Report. Over the last several years, Low supply and High demand has caused an increase in home prices. There are certainly many things that have contributed to inflating home prices, but we won’t discuss that here.
6. Economics affecting the Colorado Springs Housing Market
Our Economy has been run very badly for the last several years nationally by the Political class in power. The Federal Reserve is reacting to bad political policy and effectively trying to correct or crash asset prices to “bring down inflation”. Despite what the Fed is doing, it doesn’t bring down energy and food prices which primarily impacts lower income families.
You can see inflation’s impacts with credit card debt that is at an all time high as reported by the Federal Reserve Bank of New York. American’s credit card debt is now over 1.3 Trillion. This is a $300 Billion increase since the same time last year, which is over a 30% increase. People are running out of money, it is not looking good for the consumer and the economy.
Are we heading toward a Recession?
The yield curve being inverted for the last year has a 100% record of predicting a recession. We had hit a recession last year despite the Government’s dismissal of it, but it is predicted in 2024 by most Economists that we will have a recession. The traditional definition of a recession is 2 consecutive quarters of negative GDP growth. The GDP peaked at 27.86 Trillion in September 2023 and it was 27.71 in October 2023. So the GDP has started to trend downward slightly which is consistent with a recession. It is likely that the Q4 2023 GDP will be lower than Q3 2023 GDP, which will be the first Quarter of declining GDP in over a year.
The Unemployment rate is at a Government reported 3.9% in October, up from 3.8% in September. At the start of the year in January the unemployment rate was at 3.4%. Anything at 5% or below is traditionally ok which is primarily due to frictional unemployment. So there doesn’t seem to be any thing to be concerned too concerning about the unemployment rate rising slightly. Some economists say that many people have 2 or 3 jobs so the unemployment number is skewed and doesn’t reflect reality. What is certain is that incomes have not increased overall to offset prices. Although minimum wage jobs have increase to $14 or more, overall wages have not increased enough everywhere else.
What CAN WE EXPECT with the Colorado Springs Housing Market?
You could say that the Federal Reserve and the Government are cyclical and predictable. You may have heard the saying, Weak leaders bring hard times, Hard times bring strong leaders, Strong leaders bring good times, Good times bring Weak leaders, and they cycle continues. I believe we are in the “Weak leaders bring hard times” part of the cycle. We’ll see what happens in 2024, it could get ugly.
The one thing that I did get right was that I did say in February that I expect that the inventory will increase 30% as we get to June. In fact, in June, we did increase over 30% and at the end of June the inventory was 1618 active homes on the market. This is not too unusual as there are typically more homes on the market in the summer, but it was a significant jump. We are currently at 1350 active homes on the market, so we are getting a little high for Colorado Springs. This would not be uncommon going into the selling season, but we are heading into the winter months and the supply is in general increasing. This will continue to increase days on market and more importantly the Absorption rate which is a better metric for predicting a buyer or seller market.
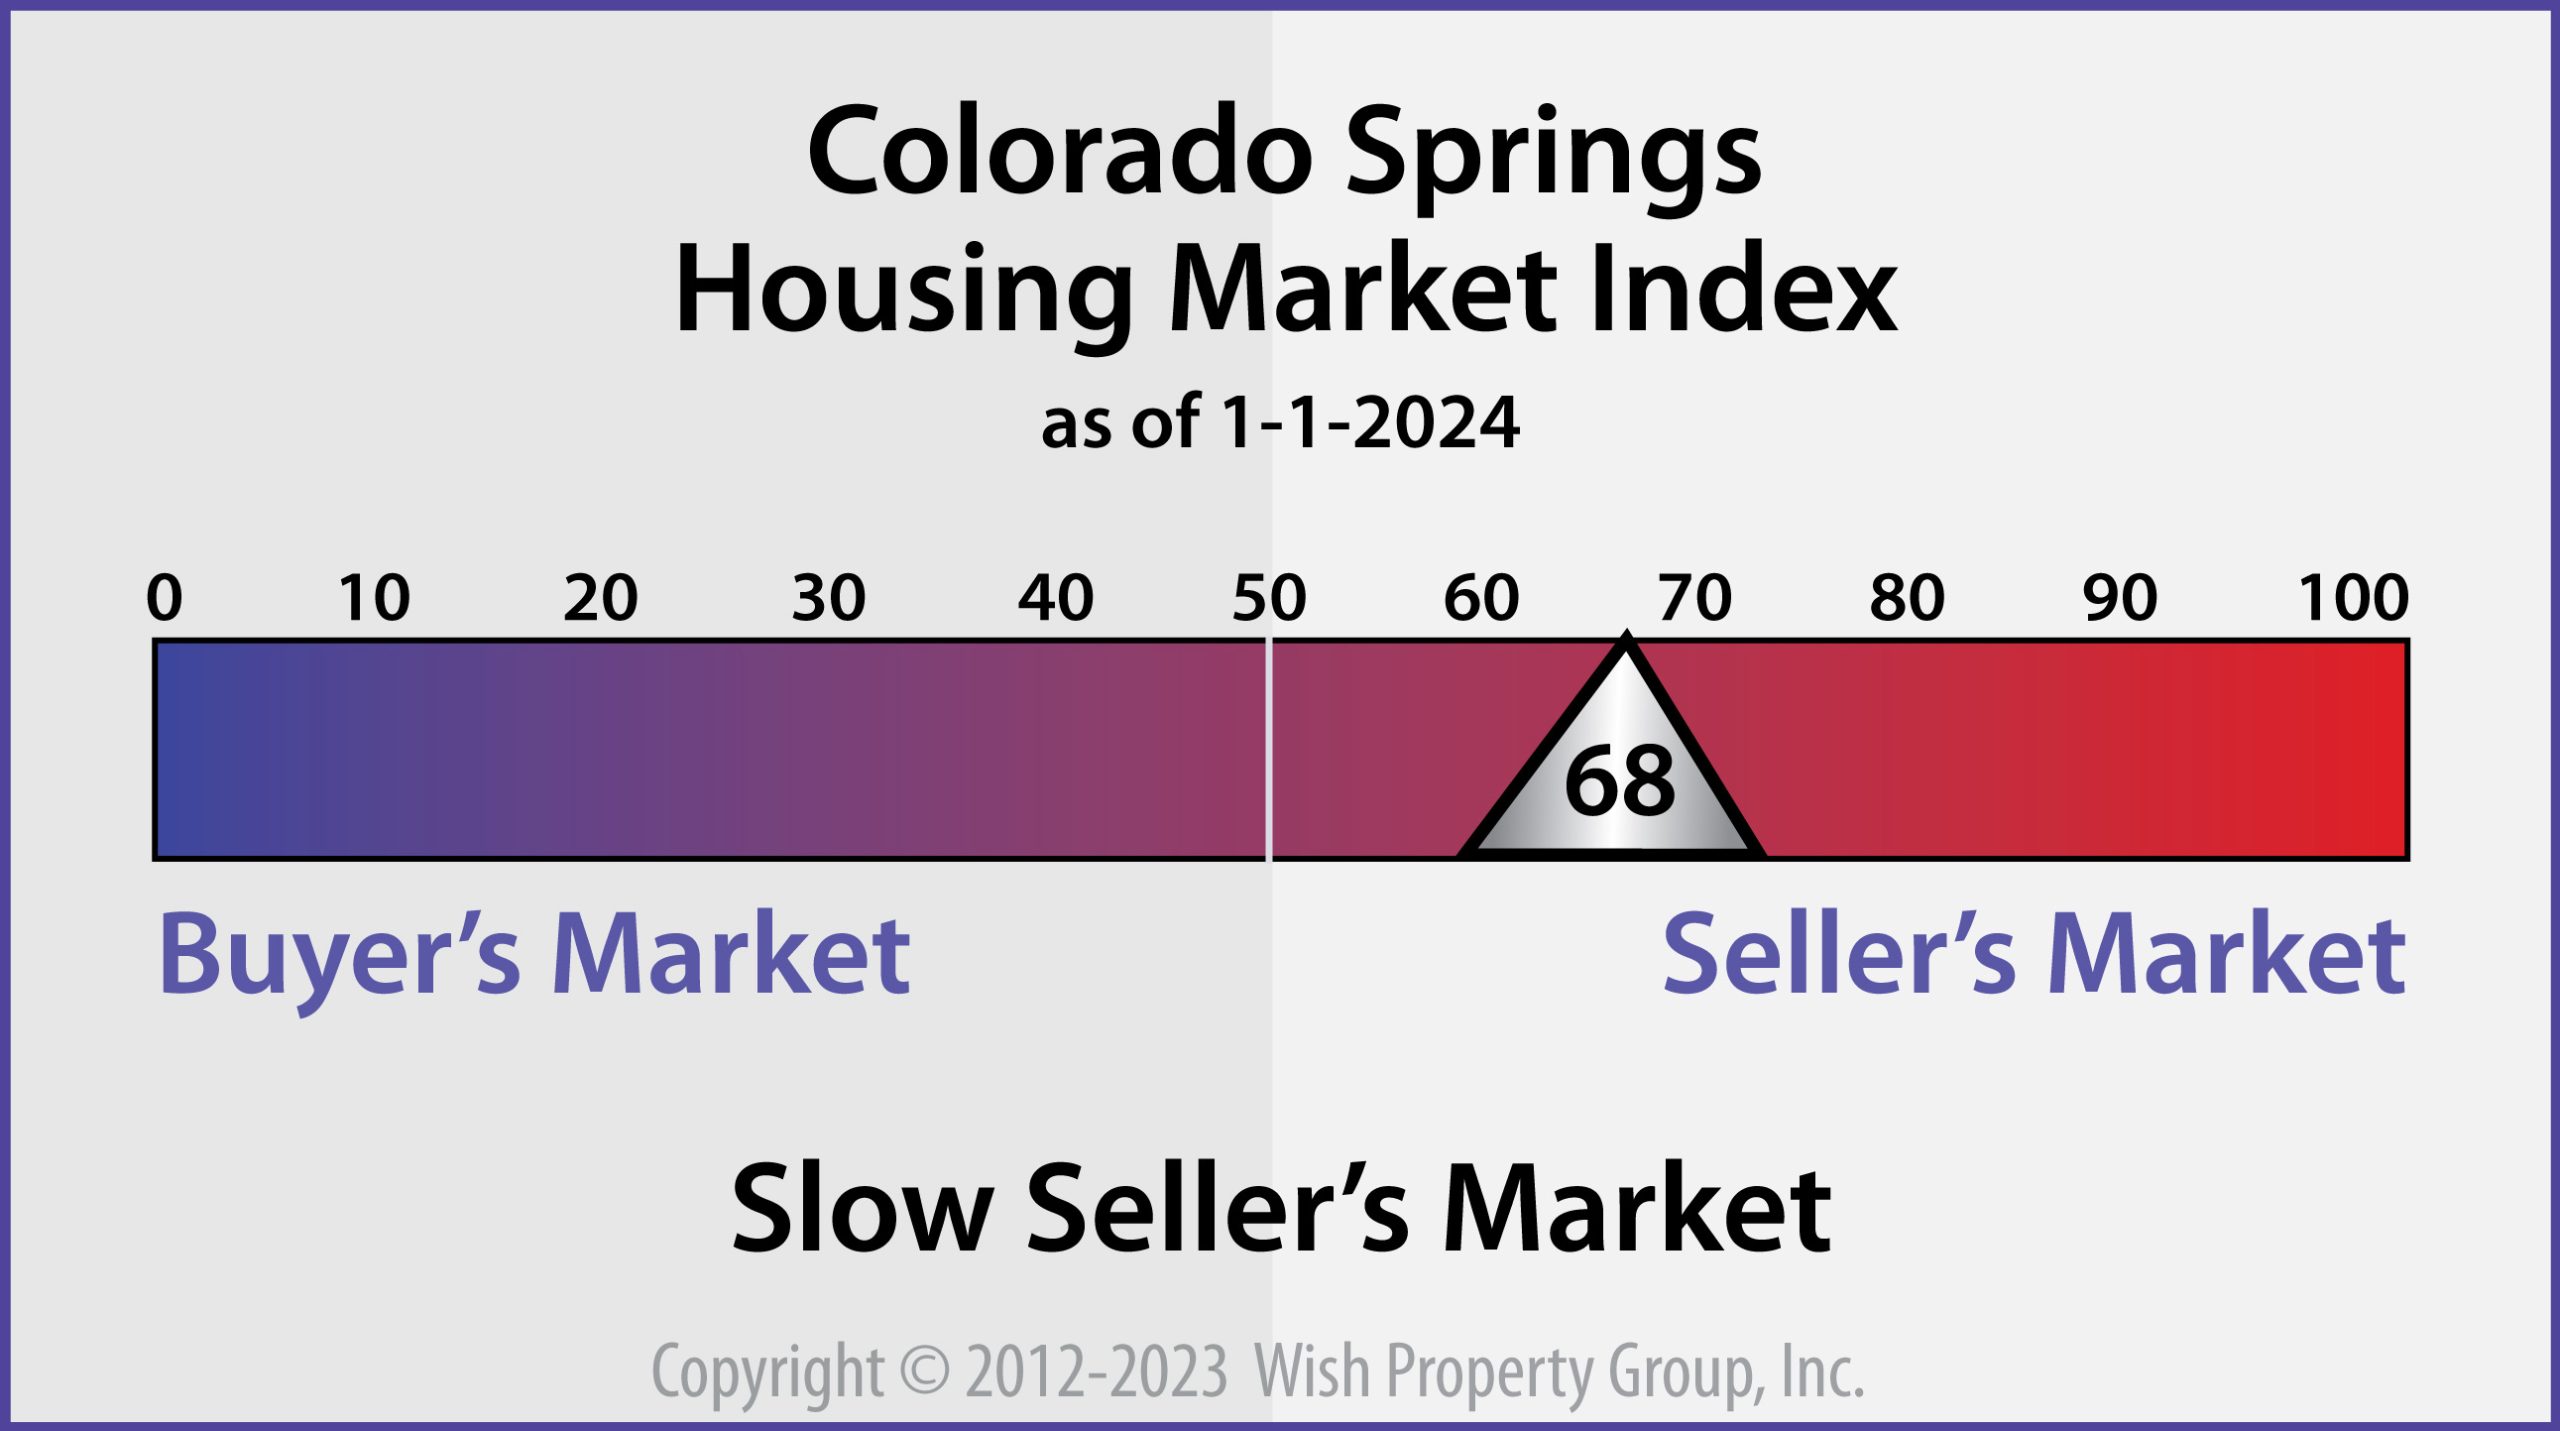
7. Seller’s Market or Buyer’s Market?…is that the right question?
So is it a Seller’s market or a Buyer’s market? It really depends on your perspective right now. On paper it is still a Seller’s market, although a Slow Seller’s market. Buyer’s are not having to compete in multiple offer situations, so it is an easier buyer’s market. Buyer’s are able to offer several thousands below list price and there are many price decreases on Active homes. Nearly fifty percent of homes on the market have had at least one price decrease. However prices are still nearly higher than they’ve ever been and most Sellers don’t have to sell Short of what they owe.
So, it is still a Seller’s market although it will take sellers longer to sell their home. It’s really not a buyer’s market as prices are still too high given the high interest rates making mortgages unaffordable. So the Colorado Springs housing market is sluggish at the moment. There are plenty of homes available, but prices are too high for many buyers. You are lucky if you get close to your asking price as a seller in this market.
How the Absorption Rate impacts the Colorado Springs Housing Market?
So if the Absorption Rate (Inventory processing) is slow (higher number), that means there will be an increase in supply. This leads to a buyer’s market. If Absorption Rate is fast (lower number), that means there will be a decrease in supply of homes, so this leads to a seller’s market. It is really a function of supply and demand. Supply is the current inventory of homes and demand is what has been sold in a given time frame.
Absorption Rate is the best metric to determine if we are in a buyer’s or seller’s market. However, knowing average days on market, the percentage of recent price decreases, home price trends, and home sales trends are obviously good metrics to determine market conditions as well.
The Absorption Rate number has been increasing steadily and is at the highest it’s been in over 2 years. The current Absorption Rate number is 2.2 months of inventory or 66 days. In general, I would say that once we hit 4.0 months or 120 days of inventory that we are officially in a Buyer’s market on paper. We rate this with a market index score, the current market index score is 68 and if it hits 50 or less, we deem it to be a Buyer’s market. So 50 is the transition point between a Buyer’s and Seller’s market, at least with our rating system.
Conclusion – It is a Slow Seller’s market
So is it a Buyer’s or Seller’s market? It really depends on your situation and how you look at things. If you are a Seller and home prices don’t come down at all and it take 3 months to sell, then I’d say it is a seller’s market because you are still making a lot of money. If you are a Buyer and you get a home for $40k less than list price, then it is kind of a Buyer’s market, but you are likely still over paying for the house. So is it really a Buyer’s market at that point? We have high home prices and high interest rates causing affordability to be unreasonable given wage growth not keeping up with inflation. The Case-Shiller Home Price Index was at 312 in Sept, compared to about 100 in the year 2000 and about 184 at the peak of the 2006 Global Financial Crisis (GFC). The should provide perspective as to the lack of affordability for buyers and that it is likely this housing bubble is going to burst. So on paper and in reality I’d definitely say we are still in a Slow Seller’s market.
Updated by the 7th day of every month. Metrics for Single Family Homes in the Colorado Springs region of El Paso County. Data provided by Pikes Peak Realtor® Services Corp., Absorption Rate calculations provided by Wish Property Group, Inc.®